We’re happy to announce a new Semaphore feature that will help you monitor and improve your CI speed over time. We’re calling it CI Speed Insights, and it’s available to all Semaphore users as of today.
Here’s how it works. On the project page, below all of your recently active branches, you’ll find a chart. In it, you’ll be able to see the runtime duration of recent builds and an indicator of your average CI speed, in minutes:
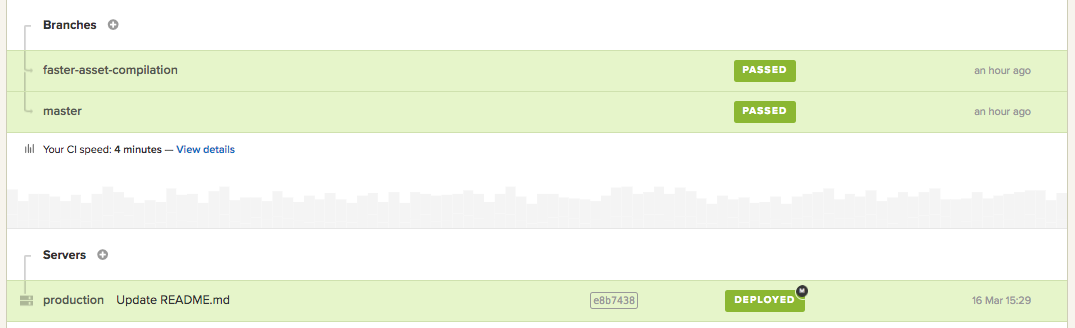
The chart will also include a line indicating the 10 minute mark, in case your build runs around or longer than that.
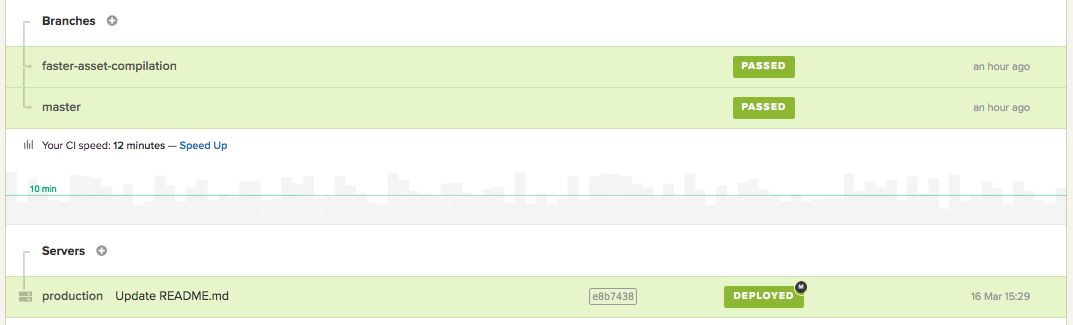
Why 10 minutes?
We’re convinced that having a build slower than 10 minutes is not proper continuous integration. When a build takes longer than 10 minutes, we waste too much precious time and energy waiting, or context switching back and forth. We merge rarely, making every deploy more risky. Refactoring is hard to do well. You can read our full rationale about this in our recent blog post — What is Proper Continuous Integration?.
There’s more to CI Speed Insights if you click to view the details.
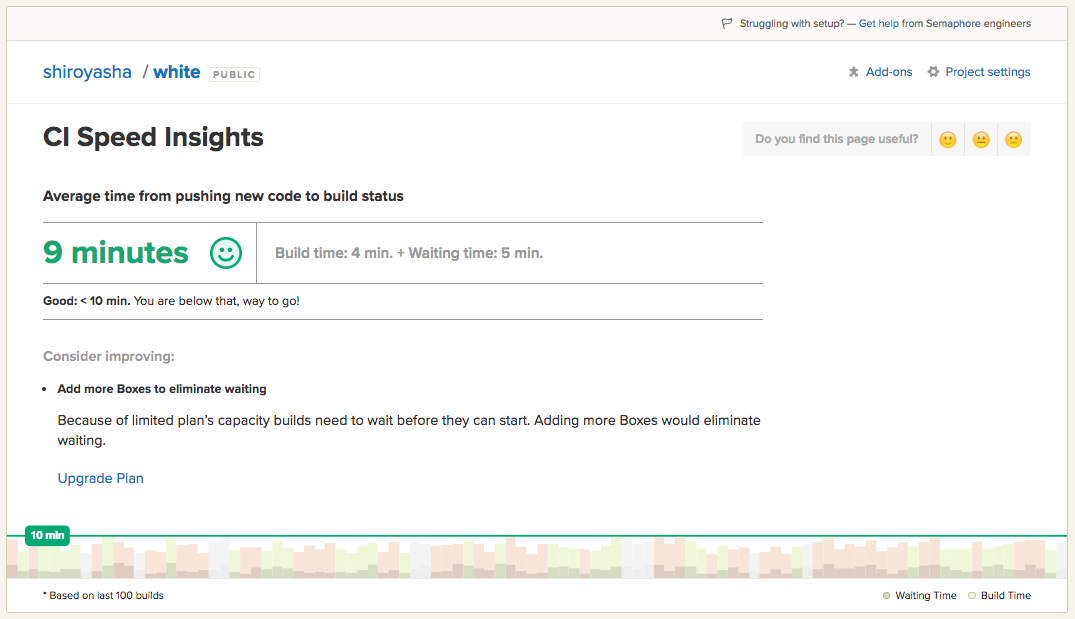
Measuring CI speed
We’ve defined CI speed as the average time that elapses from pushing new code to getting the build status report. In many cases this is how long it takes for your build setup and tests to run on Semaphore. However, another possibility is that your build is blocked waiting for available resources, which are being used by other builds. When this happens, you’ll see hints on Semaphore that point you to the Activity Monitor.
So, if your build runs for 4 minutes on average, but is waiting for other builds to finish for 5 minutes on average, then the CI speed for that project is reported as 9 minutes. This is what the screenshot above illustrates.
At the bottom of the screen, you’ll find an interactive chart of your recent builds that shows both the build runtime and your waiting time. You can click on each one to view full build details.

If your build lasts too long, Semaphore will recommend running tests in parallel. You can set this up by manually configuring parallel jobs. This is a great way to cut down your build time.
Automatic test parallelisation
Still, wouldn’t it be great if Semaphore could automatically parallelise all your tests for you, without any effort needed on your side? We’ve been hard at work on making that possible. A recent beta customer managed to reduce build time from 2 hours to 8 minutes(!).
The initial release of automatic parallelisation will support Ruby — RSpec and Cucumber to be precise. If you’re using these tools and are interested in setting up automatic parallelisation in your project, please get in touch with us to schedule a personal demo. We’re excited to show you how Semaphore can optimize the way your team runs tests.
Happy building!